Data Presentation Basics
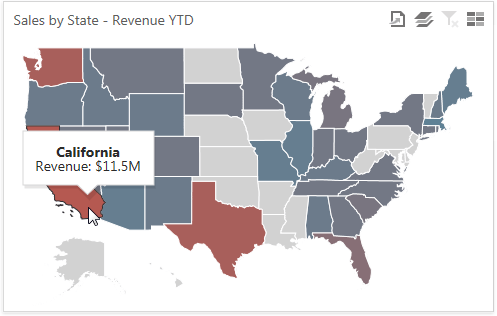
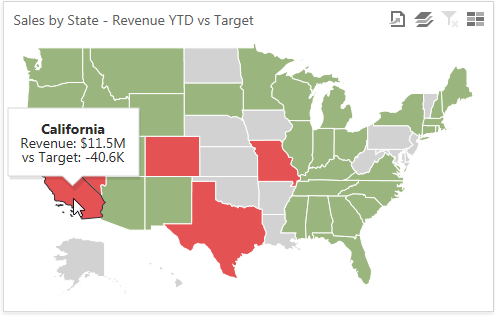
The Choropleth Map dashboard item colorizes map areas in two ways.
Based on the provided values.

Based on the difference between the actual and target values of a particular parameter.

You can switch between the provided values using the Values button (the  icon) in the map's caption.
Map Zooming and Scrolling
Use the following actions to scroll a map.
- Zooming
Use the mouse scroll wheel to change the current zoom level for the map.
On a touchscreen device, use pinch or spread gestures to change the current zoom level.


- Scrolling
To scroll the map, hold down the left mouse button and drag it.
On a touchscreen device, use flick gestures to scroll the map.

Tooltip
The Choropleth Map dashboard item can display a tooltip that shows information on a hovered area.
